
Which is the stronger force: marriage or divorce? In this review, we’ll examine the US marriage and divorce stats in the United States over the last twenty years and find out. Not only will you discover the nationwide trends, but you can discover how things break down in each state, including where you live!
The Importance of Understanding Trends
Just because the directions for marriage and divorce are on the decrease doesn’t mean it’s going to be that way forever. History shows us that humanity goes through cycles of values, beliefs, and cultural practices. We can conclude from our cultural moment based on trends that got us to this point, but we can also identify emerging trends that might carry us in a different direction altogether! Examining current trends can help us better understand what America’s future might hold.
How Data is Collected and Analyzed
We pulled some excellent information, statistics, and research on US marriage and divorce from LegalHandle and the Centers for Disease Control and Prevention (CDC). LegalHandle has conducted an exhaustive study of marriage and divorce trends from 2000 to 2019, while the CDC has some thorough research covering 2019 to 2021.
Overall US Marriage and Divorce Rates
Let’s look at the marriage and divorce rates in the United States overall. We have numbers from 2000-2019, and we’ve identified an interesting trend: the rate of marriage and divorce has dropped significantly in the US. More often, people choose to cohabitate with their partners than to get married in the first place.

National Marriage Rate Trends
Here you’ll find the total number of marriages along with the marriage rate per 1,000 total population in the United States. It covers 2000 through 2019. Upon closer examination, one can see that, although the US population is moving up, the marriage rate has been dropping for the past twenty years with a few slight upticks here and there. The marriage rate has fallen nearly 2% since the year 2000.
| Year | Marriages | US Population | Rate Per 1,000 Total Population |
|---|---|---|---|
2019 | 2,015,603 | 328,239,523 | 6.1 |
2018 | 2,132,853 | 327,167,434 | 6.5 |
2017 | 2,236,496 | 325,719,178 | 6.9 |
2016 | 2,251,411 | 323,127,513 | 7.0 |
2015 | 2,221,579 | 321,418,820 | 6.9 |
2014 | 2,140,272 | 308,759,713 | 6.9 |
2013 | 2,081,301 | 306,136,672 | 6.8 |
2012 | 2,131,000 | 313,914,040 | 6.8 |
2011 | 2,118,000 | 311,591,917 | 6.8 |
2010 | 2,096,000 | 308,745,538 | 6.8 |
2009 | 2,080,000 | 306,771,529 | 6.8 |
2008 | 2,157,000 | 304,093,966 | 7.1 |
2007 | 2,197,000 | 301,231,207 | 7.3 |
2006 | 2,193,000 | 294,077,247 | 7.5 |
2005 | 2,249,000 | 295,516,599 | 7.6 |
2004 | 2,279,000 | 292,805,298 | 7.8 |
2003 | 2,245,000 | 290,107,933 | 7.7 |
2002 | 2,290,000 | 287,625,193 | 8.0 |
2001 | 2,326,000 | 284,968,955 | 8.2 |
2000 | 2,315,000 | 281,421,906 | 8.2 |
Note: These statistics and research on US marriage rate trends come from LegalHandle.
Marriage Rates Per State
Now that we’ve gotten a good idea of the marriage rates across the United States, let’s break this down to the state level and see which areas of the country experience the highest and lowest marriage rates. We’ll also examine the most significant marriage rate increases and decreases between 2019 and 2021. All statistics and data we’re presenting in this section come from the Centers for Disease Control and Prevention (CDC).
Top 5 States with the Highest Marriage Rates
According to the CDC’s 2021 statistics and research, Nevada is at the top of the heap when it comes to the highest rate of marriage (and by a long shot, too). Nevada is a major destination for elopers and those who want to get married on a whim! It might have something to do with all the wedding chapels you find in Las Vegas or Reno.
Hawaii makes it near the top of the list because there are a ton of people who plan destination weddings on the islands to enjoy the beautiful weather and tropical settings. Utah and Arkansas are two states steeped in more traditional values on family and marriage than most other states, Utah with its LDS culture and Arkansas with its conservative, Southern values.
Montana is a true anomaly to us. It’s one that we’d have to do a lot more research. We cannot definitively conclude why they have such a high marriage rate, not to mention why they have one of the most significant marriage rate increases of any state between 2019 and 2021 (more on that later).
2021 Statistics
| State | Marriage Rate Per 1,000 Total Population |
|---|---|
Nevada | 26.2 |
Hawaii | 12.8 |
Montana | 11.0 |
Utah | 9.1 |
Arkansas | 8.2 |
Top 5 States with the Lowest Marriage Rates
According to the CDC, these are the states with the lowest marriage rates. Examining these numbers and trying to find some correlation between the states that make it on the list is interesting. These top five don’t point to one common denominator because these states are well scattered throughout the nation’s diverse regions: New England, the Upper Midwest, the South, and the Mid-Atlantic.
Something else we noticed about these five states is that they also saw decreases in the number of marriages between 2019 and 2021, according to the CDC. Louisiana nearly tops both lists, #1 for the lowest rate of marriage and #3 for the most significant decrease in the marriage rate between 2019 and 2021. The trend is consistent with these five states: fewer people from these areas of the country are interested in getting married with each passing year.
2021 Statistics
| State | Marriage Rate Per 1,000 Total Population |
|---|---|
Louisiana | 4.4 |
Massachusetts | 4.6 |
Illinois | 4.7 |
Minnesota | 4.8 |
Delaware | 4.9 |
Highest Marriage Rate Increase by State by Percentage
Now let’s look at which states saw an increase in their overall marriage rate between 2019 and 2021. It’s an interesting phenomenon that we will surely keep an eye on! As mentioned earlier, Montana tops the list by a wide margin for reasons we’re still determining.
| State | Marriage Rate Increase |
|---|---|
Montana | 3.1% |
Utah | 1.0% |
Alabama | 0.9% |
Texas | 0.9% |
Connecticut | 0.4% |
Wyoming | 0.4% |
Nevada | 0.3% |
Maine | 0.2% |
Nebraska | 0.2% |
South Carolina | 0.2% |
South Dakota | 0.2% |
Arizona | 0.1% |
Colorado | 0.1% |
Kansas | 0.1% |
New Hampshire | 0.1% |
Tennessee | 0.1% |
Source: CDC/NCHS, National Vital Statistics System
Key Takeaways
- Montana experienced the most considerable increase in its marriage rate (3.1), by a margin of over two percentage points from the runner-up, Utah (1.0).
- Arizona, Colorado, Kansas, New Hampshire, and Tennessee are tied for increasing their marriage rates by the smallest amount.
- Exactly sixteen states saw an increase in their marriage rates. More states saw a marriage rate decrease than saw a rise.
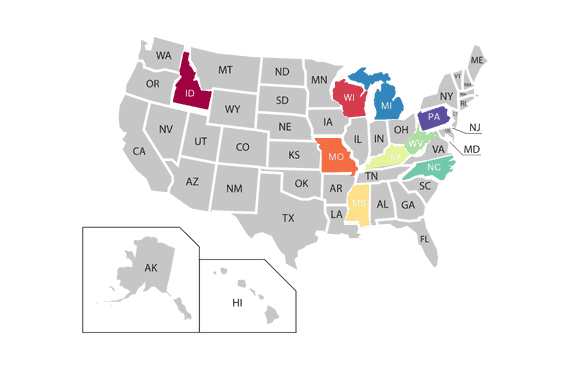
No Increase or Drop (2019-2021)
- Idaho
- Kentucky
- Michigan
- Mississippi
- Missouri
- North Carolina
- Pennsylvania
- West Virginia
- Wisconsin
This means that exactly half of the states didn’t experience a decrease in their marriage rates: sixteen saw increases, and nine stayed the same.
Highest Marriage Rate Decrease by State by Percentage
Now let’s examine the states that saw the biggest drop off in their marriage rates between 2019 and 2021. All information and statistics presented in the chart are according to the research of the Centers for Disease Control and Prevention (CDC).
| State | Marriage Rate Decrease |
|---|---|
New York | 2.0% |
Hawaii | 1.4% |
Louisiana | 0.7% |
California | 0.5% |
Georgia | 0.5% |
Illinois | 0.5% |
Maryland | 0.4% |
Massachusetts | 0.4% |
Florida | 0.3% |
Minnesota | 0.3% |
Oregon | 0.3% |
Rhode Island | 0.3% |
Vermont | 0.3% |
Alaska | 0.2% |
Arkansas | 0.2% |
Indiana | 0.2% |
North Dakota | 0.2% |
Oklahoma | 0.2% |
Virginia | 0.2% |
Washington | 0.2% |
Delaware | 0.1% |
Iowa | 0.1% |
New Jersey | 0.1% |
New Mexico | 0.1% |
Ohio | 0.1% |
Source: CDC/NCHS, National Vital Statistics System
Key Takeaways
- New York experienced the most considerable decrease in its marriage rate (2.0), with Hawaii being the runner-up (1.4). All other states saw less than a 1% decrease in the marriage rate between 2019 and 2021.
- Delaware, Iowa, New Jersey, New Mexico, and Ohio are tied for having the most minor decreases in their marriage rates.
- Exactly twenty-five states saw a decrease in their marriage rates. The District of Columbia also had a significant marriage rate decrease of 0.5.

National Divorce Rate Trends
Now that we’ve established the marriage rates by state let’s look at the divorce rates. One thing that we can definitively conclude from the data we’ve gathered is that there’s a correlation between the drop off in marriage rates and the drop off in divorce rates. With fewer people getting married and choosing to cohabitate, there are fewer divorces as a result.
For the most part, the divorce rate has also been on a downward trajectory since 2000. There have been a few rises and falls here and there, but it’s mostly been a consistent drop with each passing year. This falls right in line with the marriage rate dropping consistently over the same twenty-year period. With fewer marriages, there are also fewer people filing for divorce.
| Year | Divorces | US Population | Rate Per 1,000 Total Population |
|---|---|---|---|
2019 | 746,971 | 272,842,748 | 2.7 |
2018 | 782,038 | 271,791,413 | 2.9 |
2017 | 787,251 | 270,423,493 | 2.9 |
2016 | 776,288 | 257,904,548 | 3.0 |
2015 | 800,909 | 258,518,265 | 3.1 |
2014 | 813,862 | 256,483,624 | 3.2 |
2013 | 832,157 | 254,408,815 | 3.3 |
2012 | 851,000 | 248,041,986 | 3.4 |
2011 | 877,000 | 246,273,366 | 3.6 |
2010 | 872,000 | 244,122,529 | 3.6 |
2009 | 840,000 | 242,610,561 | 3.5 |
2008 | 844,000 | 240,545,163 | 3.5 |
2007 | 856,000 | 238,352,850 | 3.6 |
2006 | 872,000 | 236,094,277 | 3.7 |
2005 | 847,000 | 233,495,163 | 3.6 |
2004 | 879,000 | 236,402,656 | 3.7 |
2003 | 927,000 | 243,902,090 | 3.8 |
2002 | 955,000 | 243,108,303 | 3.9 |
2001 | 940,000 | 236,416,762 | 4.0 |
2000 | 944,000 | 233,550,143 | 4.0 |
Note: These statistics and research on US divorce rate trends come courtesy of LegalHandle.
Divorce Rates Per State
Top 5 States with the Highest Divorce Rates
And the winner for the highest divorce rate is (drum roll, please) Nevada! Big surprise.
Yes, the place known for quickie weddings and 10-minute ceremonies is also the US leader for divorces. You get a lot of couples here who end up having buyer’s remorse and getting an annulment afterward.
Source: CDC/NCHS, National Vital Statistics System
(CDC didn’t have data for California, Hawaii, Indiana, Minnesota, and New Mexico.)
2021 Statistics
| State | Highest Divorce Rates |
|---|---|
Nevada | 4.2% |
Oklahoma | 3.8% |
Wyoming | 3.7% |
Alabama | 3.6% |
Arkansas | 3.6% |
Top 5 States with the Lowest Divorce Rates
Again, this is another set of statistics where there’s not a common theme between the states, which shows why their divorce rates are lower than other states across the nation. You get another decent cross-section of states from varying regions of the US: the South, the Midwest, the High Plains, the Mid-Atlantic, and New England.
Massachusetts leads the pack on this one. And it makes sense when you see that they’re #2 on the list for the lowest marriages in the nation. Because fewer Massachusetts residents are getting married, they’re also experiencing fewer divorces. The same could be said for Illinois (#3 for fewest marriages).
Source: CDC/NCHS, National Vital Statistics System
(CDC didn’t have data for California, Hawaii, Indiana, Minnesota, and New Mexico.)
2021 Statistics
| State | Lowest Divorce Rates |
|---|---|
Massachusetts | 1.0% |
Illinois
| 1.3% |
Texas | 1.4%
|
Maryland | 1.6%
|
Kansas | 1.9% |
Highest Divorce Rate Increase by State by Percentage
As divorce rates are falling nationwide, only five states have seen an increase in the rate of divorce between 2019 and 2021. In addition to these five outliers, the District of Columbia also saw a rise in its divorce rate by 0.2.
| State | Divorce Rate Increase |
|---|---|
Mississippi | 0.7% |
North Dakota | 0.4% |
Virginia | 0.2% |
North Carolina | 0.1% |
Washington | 0.1% |
Source: CDC/NCHS, National Vital Statistics System
(CDC didn’t have data for California, Hawaii, Indiana, Minnesota, and New Mexico.)
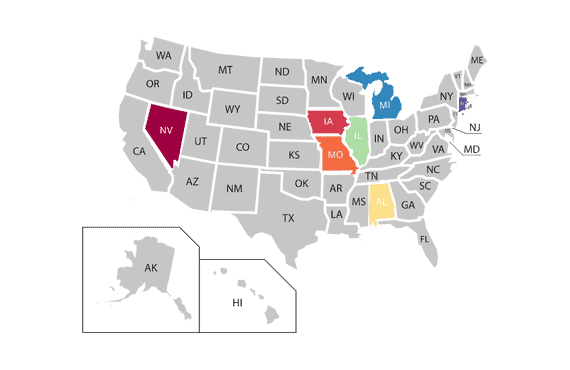
There are also several states whose divorce rates remained the same during these three years. They neither increased nor decreased the rate of divorce. They include:
- Alabama
- Illinois
- Iowa
- Michigan
- Missouri
- Nevada
- Rhode Island
Highest Divorce Rate Decrease by State by Percentage
While marriage trends in the United States have been decreasing since 2016, likewise, the divorce rate trends downward nationwide. Nearly all the states, apart from five (plus five more the CDC doesn’t have data for), have seen a steady drop in their divorce rates. Maryland is the only state that’s seen more than a 1% increase in the divorce rate drop.
| State | Divorce Rate Decrease |
|---|---|
Maryland | 1.1% |
New York | 0.7% |
Texas | 0.7% |
West Virginia | 0.7% |
Alaska | 0.5% |
Idaho | 0.5% |
Massachusettes | 0.5% |
Montana | 0.5% |
New Hampshire | 0.5% |
Oregon | 0.5% |
Vermont | 0.4% |
Kansas | 0.4% |
Colorado | 0.3% |
Delaware | 0.3% |
Maine | 0.3% |
New Jersey | 0.3% |
Arizona | 0.2% |
Connecticut | 0.2% |
Louisiana | 0.2% |
Ohio | 0.2% |
Pennsylvania | 0.2% |
South Carolina | 0.2% |
Tennessee | 0.2% |
Utah | 0.2% |
Wisconsin | 0.2% |
Florida | 0.1% |
Georgia | 0.1% |
Kentucky | 0.1% |
Nebraska | 0.1% |
Oklahoma | 0.1% |
South Dakota | 0.1% |
Wyoming | 0.1% |
Source: CDC/NCHS, National Vital Statistics System
(CDC didn’t have data for California, Hawaii, Indiana, Minnesota, and New Mexico.)
Demographic Factors Influencing Marriage and Divorce Rates
When you’re examining marriage and divorce rates in the United States, there are a ton of factors that you need to consider, including age, level of income, religious affiliation, and many others. We’re going to dive deep into the minutiae of the contributing factors that make for a successful marriage, or that sow the seeds of an imminent divorce.
US Marriage/Divorce Fast Facts:
- The US population is over 334 million as of January 2023.
- The average US marriage lasts around 8 years.
- The current divorce rate is 2.9 persons per 1,000 people.
- 750,000 divorces occur each year in the US.

Age at First Marriage
The age at which you marry can drastically affect the success of your marriage or relationship. There are exceptions, but the general rule is that the younger you marry, the more likely the marriage with end in a divorce. High-quality marriages become more frequent when you marry in your late 20s or beyond.
50% of people who marry under the age of 18 will end in a divorce, right on par with the national average divorce rate, which is 45-53% of current marriages. Divorces that result from partners who got married too young comprise a large portion of the overall divorce number for the entire United States.
And it’s interesting to see how the possibility of divorce gets lower the older you marry. For instance, people who marry under 20 (only two years removed from the teenage years) have only 40% of their marriages ending up in a divorce. And if you’re 25 or under, the chances of divorce lower to 24%!

Education Level
We’ve discovered some anecdotal evidence that the higher your level of education, the better chances you’ll have of success in your marriage. College-educated men and women are more likely to marry at an older age and when they’ve become financially viable or settled into a promising job/career. So, it’s not just your level of education but your age and maturity level when you’ve completed school that will decrease the likelihood of a divorce once you’re married.

Income Level
Having a steady income alleviates many potential problems within a marriage. Suppose there’s stability and comfort due to an ideal financial situation. In that case, there’s a good chance that the marriage will be successful because there will be no strife over things like a tight budget or the mismanagement of limited funds.

Religious Affiliation
Married couples who are religious tend to stick together more than couples who don’t practice religion or don’t hold any religious beliefs whatsoever. Many religions, such as Christianity, Judaism, and Islam, extol traditional values of marriage, family, and commitment to one’s household. Couples serious about their faith tend to endure marriage hardships a lot longer before resorting to divorce or separation.
Trends in Reasons for Divorce
There are many reasons why married couples choose to divorce instead of working out their differences and trying to make the marriage work.

Infidelity
One of the primary factors leading to divorce is a partner cheating on their spouse. You may or may not be surprised that many couples will stay together after an affair has occurred but will often be unhappy or dissatisfied with their marriage. Around 64% of US married couples are reported to stay together after one of the partners was caught in an affair. 31% of couples file for a divorce or separation after an affair has been discovered.

Financial Issues
Another major contributor to divorce rates in the United States is financial hardship or disagreements. It’s estimated that around 20-40% of divorces in the US result from problems married couples have regarding their finances. Couples who aren’t on the same page with income and budgeting can butt heads and experience a lot of frustration with one another. For many, the solution is to get out of the relationship altogether, unfortunately.

Lack of Communication
When there’s no reciprocation in a relationship, this can take a severe toll on the quality of the connection you experience with your spouse. Some studies show nearly 68% of marriages ended because one or both partners felt there was a severe lack of communication. How can you expect you or your partner to feel fulfilled if you never tell each other anything, express your needs, or share deep, intimate thoughts?

Abuse
We’ve seen studies that suggest anywhere from 20-35% of all divorces in the United States are the result of physical or verbal abuse. And every nine seconds, a woman is beaten or assaulted in the US. We know this isn’t always domestic abuse, but it’s enough for us to know with certainty that physical abuse is a significant contributor to the US divorce rate.
The Future of Marriage and Divorce Rates
It’s hard to know what the future will bring because there are no guarantees in life. But based on the US marriage and divorce statistics we’ve gathered, we can make some speculations based on the trends we’re seeing to extrapolate what might be ahead for the United States.

Predictions and Projections
Based on the dwindling marriage and divorce rates nationwide, we can only speculate that these numbers will continually drop as more Americans are interested in cohabitating over getting married. It might result in fewer legal proceedings to annul a union. Still, many have concerns about future generations of children who grow up in cohabitating homes that tend to be more unstable and can be thrown into turmoil much more manageable if one partner decides that they’re out.

Factors That May Influence Future Trends
History goes in cycles. There are periods of history where people adopted and followed more of a traditional values system where family, marriage, and commitment are the priority. Then there are times when the population, by and large, begin drifting from these principles and embraces worldwide, which says to enjoy your youth, look out for yourself, and commit to a serious relationship later in life once you’ve had your fun. And if you decide that your marriage was a mistake, it’s nothing that a quick divorce can’t fix.
We may see a trend in the future where people in the United States swing back in the other direction and firmly embrace the principles of family, marriage, and commitment. We may see an increase in marriage rates and a continual plunge in divorce rates as Americans return to more traditional values. We’ve seen the chaos and turmoil our nation has been through in the past several years, and there’s no denying that much of it is the effect of broken homes and fatherlessness.
Conclusion
And now, some closing words on marriage and divorce in the United States in 2023 based on the statistics and information we’ve reviewed.
The Importance of Analyzing Marriage and Divorce Statistics
Relationships can be nuanced, and there are more than one or two factors at play when it comes to marriage and divorce across the nation. By taking a close look at marriage and divorce statistics across the United States, you can better understand the factors that lead to successful, flourishing marriages or down the path of divorce. Analyzing these statistics can help us better understand what goes into supporting and fostering a healthy marriage or setting the groundwork for a relationship that will lead to a good, fulfilling marriage.
Supporting Healthy Relationships and Marriages
If you want to experience a marriage that will last for more than the average eight years that most American marriages experience, take some of the contributing factors for divorce that we share to heart. Cheating or abusing your spouse will almost always increase your chances of getting a divorce. Good communication is critical. And it never hurts to be on the same page with finances and money!